
Have you ever worked hard to improve rankings, publish better content, and build links, only to find that your pages still feel slow or awkward for visitors? That’s where Core Web Vitals starts to matter. If a page loads late, shifts around, or reacts slowly, users notice it before analytics tells you.
For marketers, Core Web Vitals is more than a technical checklist. It sits at the intersection of SEO, UX, conversion rate, and brand perception. A fast, stable page helps people trust what they see and keep moving toward a click, sign-up, or purchase.
This guide explains what Core Web Vitals are, why they matter for SEO, how to measure them, and what to fix first. If you work with content teams, developers, or clients, you’ll leave with a practical framework instead of vague advice.
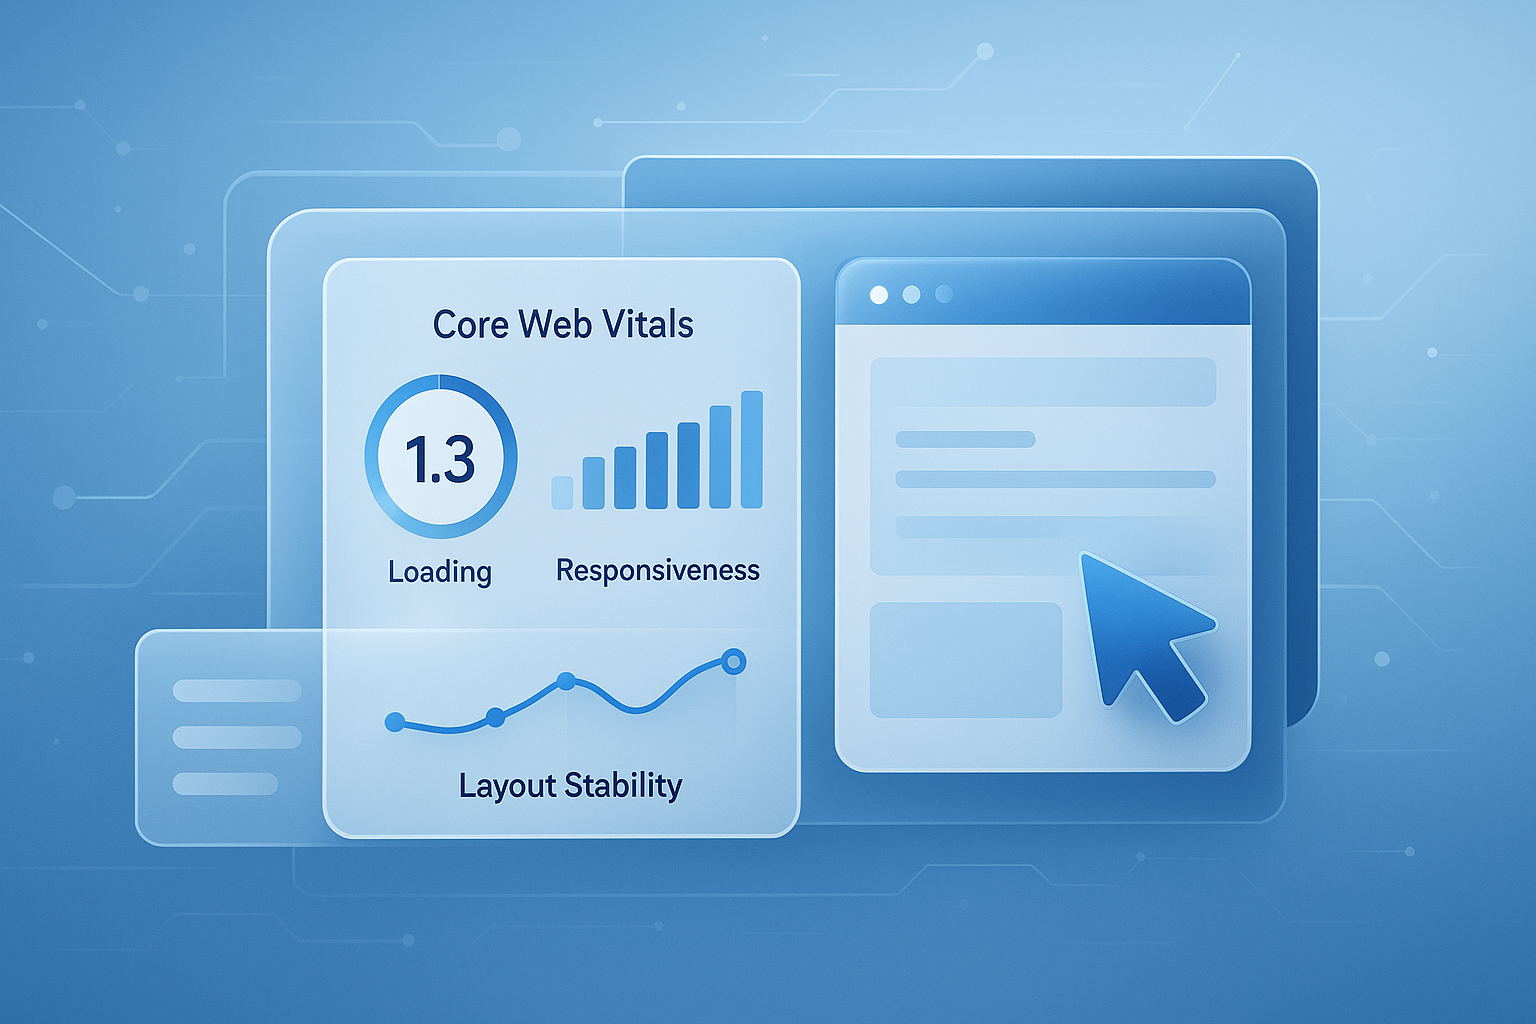
Suggested Image: Technology concept showing page speed, site performance metrics, and mobile user experience dashboard
What are Core Web Vitals?
Core Web Vitals are Google’s user-focused performance metrics that measure how quickly a page appears useful, how responsive it feels, and how visually stable it remains while loading. In simple terms, they help answer one question: does your page feel good to use in the real world?
Google currently focuses on three main metrics:
- Largest Contentful Paint (LCP): measures loading performance
- Interaction to Next Paint (INP): measures responsiveness
- Cumulative Layout Shift (CLS): measures visual stability
These metrics are part of Google’s broader page experience signals, but they deserve special attention because they directly reflect what users see and feel. Google explains the standards in its official Web Vitals documentation.
For marketers reviewing landing pages, blog posts, and lead funnels, these numbers help turn a vague complaint like “the site feels slow” into something measurable and fixable. If you also manage page assets, using lightweight visuals matters. A tool like Image Compressor can help reduce heavy image files before they hurt load performance.
Why Core Web Vitals matter for SEO and UX
Core Web Vitals matters because it affects both discoverability and usability. It is not the only ranking factor, and great content still matters more, but when pages are equally relevant, a better user experience can strengthen your overall search performance.
Let’s look at why.
- Better user experience: visitors can read, tap, and navigate without friction
- Stronger engagement: faster pages can reduce abandonment and improve time on page
- Higher conversion potential: fewer delays mean less resistance during sign-up or checkout
- Cleaner technical SEO foundation: performance issues often reveal deeper implementation problems
Google has stated through Google Search documentation on page experience that page experience is one of many ranking considerations. That means Core Web Vitals won’t rescue weak content, but it can support strong content by making it easier to consume.
Here’s the problem many teams run into: they treat SEO and UX as separate projects. In practice, they overlap. If your product page loads late on mobile, your bounce rate, conversion rate, and organic performance may all suffer at the same time.
If you’re auditing broader on-page quality, it also helps to check supporting technical factors such as file delivery and media handling. For example, PDFs used as downloadable assets can be optimized and simplified with tools such as PDF to Word when content teams need to repurpose heavy documents into lighter web-friendly formats.
The three Core Web Vitals explained clearly
Each Core Web Vitals metric measures a different part of page experience. You should read them together, not in isolation, because a page can load quickly but still feel unstable or laggy.
1. Largest Contentful Paint (LCP)
LCP measures how long it takes for the largest visible content element to appear in the viewport. That is often a hero image, banner, featured image, or large block of text near the top of the page.
- Good: 2.5 seconds or less
- Needs improvement: 2.5 to 4 seconds
- Poor: more than 4 seconds
If your LCP is slow, users usually feel like the page is still loading, even when some smaller elements have already appeared.
2. Interaction to Next Paint (INP)
INP measures how quickly a page responds after a user interacts with it, such as clicking a button, opening a menu, or tapping a form field. It replaced First Input Delay because it gives a better picture of ongoing responsiveness across the session.
- Good: 200 milliseconds or less
- Needs improvement: 200 to 500 milliseconds
- Poor: more than 500 milliseconds
This is where many people struggle. A page can look fine at first, yet feel frustrating when scripts block input or interface elements react too slowly.
3. Cumulative Layout Shift (CLS)
CLS measures unexpected layout movement while a page loads. If text jumps down because an image loads late, or a button shifts right before someone taps it, CLS is the metric that captures that instability.
- Good: 0.1 or less
- Needs improvement: 0.1 to 0.25
- Poor: more than 0.25
High CLS is especially harmful on mobile, where small screens make movements more disruptive. For layout and rendering behavior, developers often refer to standards and browser guidance from MDN Web Docs.
| Metric | What it measures | Good score | Typical issue |
|---|---|---|---|
| LCP | Visible load speed | ≤ 2.5s | Large images, slow server, render blocking CSS |
| INP | Responsiveness after interaction | ≤ 200ms | Heavy JavaScript, long main-thread tasks |
| CLS | Visual stability | ≤ 0.1 | Missing dimensions, late ads, dynamic embeds |
How to measure Core Web Vitals correctly
To measure Core Web Vitals well, you need both field data and lab data. Field data shows how real users experience your site. Lab data helps you diagnose what is causing the problem during testing.
Here are the tools that matter most:
- Google Search Console: shows grouped Core Web Vitals issues using real-world Chrome user data
- PageSpeed Insights: combines field data with lab recommendations
- Lighthouse: useful for controlled testing and debugging
- Chrome DevTools: helps developers inspect rendering, scripts, layout shifts, and network behavior
The fastest way for marketers to start is usually Google PageSpeed Insights. Enter a URL, review mobile results first, and pay attention to both the score and the diagnostic notes underneath.
For site-wide performance patterns, Google Search Console is often more useful than looking at single pages one by one. It helps you find template-level issues affecting categories, blog posts, product pages, or landing pages.
If you’re documenting audits or converting findings into client-ready reports, tools that simplify workflows can help. Many teams use clean exports, screenshots, and document conversions, and utilities like Word to PDF can make handoff easier when sharing final recommendations.
Field data vs lab data: what’s the difference?
Field data comes from real users on real devices, networks, and browsers. Lab data comes from simulated tests in controlled conditions. Both matter, but they answer different questions.
| Data type | Best for | Limitation |
|---|---|---|
| Field data | Seeing actual user experience and SEO impact | Can take time to reflect changes |
| Lab data | Debugging performance bottlenecks quickly | Does not capture every real-world condition |
Here’s the practical takeaway. If Search Console says a page group fails Core Web Vitals, trust that signal. If Lighthouse reveals a large JavaScript bundle or render-blocking asset, use that to find the fix.
Teams working with raw asset files may also need format conversion before optimization work begins. For example, if oversized graphics arrive in inconsistent formats, a utility like PNG to JPG can support more efficient media preparation for the web.
What causes poor Core Web Vitals scores?
Most poor Core Web Vitals scores come from a predictable mix of slow infrastructure, oversized assets, heavy scripts, and unstable layouts. The exact cause varies by site, but the patterns repeat across CMS platforms and custom builds.
Common causes of slow LCP:
- Unoptimized hero images
- Slow server response times
- Too many third-party scripts
- Render-blocking CSS or JavaScript
- Poor caching configuration
Common causes of poor INP:
- Large JavaScript files
- Too much client-side rendering
- Long tasks on the main thread
- Heavy tag manager setups
- Chat widgets, popups, and tracking scripts competing for resources
Common causes of high CLS:
- Images or videos without width and height attributes
- Ads and embeds loading into empty containers
- Web fonts causing text shifts
- Dynamically inserted banners above existing content
Now comes the important part. Many marketers assume the problem is hosting alone. Sometimes it is, but just as often the biggest issue is asset control. A compressed image, lighter font strategy, and fewer third-party additions can produce a major improvement without redesigning the entire site.
How to improve Largest Contentful Paint
To improve LCP, focus on the element users wait for most. That usually means the main headline area, hero image, or featured visual near the top of the page. The goal is to get that content visible as quickly as possible.
- Compress and resize large images. Don’t upload a 3000px file if the design only shows 1200px.
- Use modern image formats where appropriate. WebP is often more efficient than older formats.
- Reduce server response time. Better hosting, caching, and CDN delivery can help.
- Minimize render-blocking resources. Defer non-critical scripts and optimize CSS delivery.
- Preload important assets. This can help browsers prioritize key above-the-fold content.
For marketers managing image-heavy pages, this is often the easiest win. Before uploading campaign banners or blog visuals, reduce file size first with Image Resizer and compression workflows. That alone can noticeably improve perceived speed.
Suggested Screenshot: Before-and-after PageSpeed Insights report showing improved LCP after image and server optimizations
How to improve Interaction to Next Paint
To improve INP, reduce the work the browser has to do after a user interacts with the page. The page should react quickly when someone clicks, taps, types, or opens a feature.
Here’s what experienced professionals do differently:
- Audit JavaScript usage. Remove scripts that do not directly support user goals.
- Break up long tasks. Large blocks of script execution can delay visible responses.
- Limit third-party tools. Heatmaps, widgets, and ad scripts often slow interactivity.
- Use lazy loading carefully. It helps, but overdoing it can delay meaningful interactions.
- Test on mobile devices. A desktop machine may hide problems your audience actually feels.
If your landing pages depend on interactive calculators, configurators, or embedded tools, responsiveness matters even more. This is also a good reminder to keep related assets and support files efficient. Teams that create downloadable support materials sometimes clean them up with tools like PDF Compressor so supporting resources do not add unnecessary weight to the page journey.
How to improve Cumulative Layout Shift
To improve CLS, make your layout predictable before assets finish loading. Users should never feel like the page is moving under their finger or pulling content out of place.
- Set explicit width and height for images and video embeds.
- Reserve space for ads, banners, and dynamic widgets.
- Avoid injecting content above existing elements.
- Load fonts in ways that reduce visible reflow.
- Test templates, not just pages. One unstable component can affect hundreds of URLs.
This small detail changes everything: many CLS problems come from reusable site elements, not the article or product content itself. Cookie notices, sticky promo bars, newsletter popups, and embedded media are frequent culprits.
For developers and technical SEO teams, CSS behavior and media rendering guidance from the World Wide Web Consortium can be useful when diagnosing layout stability and standards compliance.
Mobile performance deserves first priority
Mobile Core Web Vitals scores usually deserve more attention than desktop because Google primarily considers mobile experiences and because real users often browse under weaker network and device conditions.
That means a page that feels acceptable on a fast office laptop may still frustrate mobile visitors. Marketers should watch for:
- Large hero images scaled down on phones
- Scripts that behave fine on desktop but lag on older devices
- Sticky elements that consume too much screen space
- Popups that trigger shifts or block interaction
If mobile pages rely on screenshots, product graphics, or blog illustrations, even basic file preparation can help. Converting oversized transparent graphics into more efficient formats with JPG to PNG or alternative compressed versions may support a cleaner visual workflow depending on the use case.
A practical Core Web Vitals workflow for marketers
Marketers do not need to become front-end engineers to improve Core Web Vitals. What they need is a repeatable process for spotting issues, prioritizing them, and working effectively with developers or content teams.
- Start with Search Console. Identify failing page groups and focus on patterns.
- Check PageSpeed Insights. Review both field and lab data for top templates.
- List high-impact pages first. Prioritize landing pages, product pages, and top blog posts.
- Separate content issues from code issues. Large media files and weak templates are not the same problem.
- Fix one category at a time. Images, scripts, fonts, layout shifts, then server issues.
- Retest after changes. Validate improvements with new lab runs and wait for field data updates.
This is also where documentation matters. A short report with screenshots, affected URLs, and expected gains is often more effective than a generic request to “make the site faster.”
| Issue type | Who usually owns it | Typical fix |
|---|---|---|
| Oversized images | Content or design team | Resize, compress, serve better formats |
| Render-blocking assets | Developer | Defer scripts, optimize CSS delivery |
| Layout shifts | Developer or ad operations | Reserve space, define dimensions |
| Slow hosting or TTFB | Infrastructure team | Improve hosting, caching, CDN setup |
Common mistakes that hurt Core Web Vitals
Many sites fail Core Web Vitals not because of one catastrophic problem, but because of many small decisions that pile up. The fixes are usually straightforward once you know where to look.
- Uploading full-resolution images straight from design tools
- Adding every marketing script without reviewing performance cost
- Using sliders, animations, or popups that delay the main content
- Ignoring template-level problems and only optimizing one page
- Relying on desktop testing while most traffic is mobile
- Chasing performance scores instead of user experience improvements
The answer depends on one thing: whether you’re trying to improve a score or improve a page. Those are not always identical goals. A perfect lab score is less important than making key pages visibly faster, more stable, and easier to use for real visitors.
Core Web Vitals and SEO in 2026: what has changed?
In 2026, the biggest shift is not that Core Web Vitals suddenly outweighs content or links. It doesn’t. The important change is that search visibility increasingly overlaps with UX quality across AI-driven search systems, summaries, and assistants that favor reliable, accessible, easy-to-use pages.
That means performance now supports more than traditional rankings. It can influence:
- How easily pages are crawled and rendered
- Whether visitors stay long enough to engage with content
- How trustworthy the experience feels on mobile devices
- How well destination pages perform after discovery in search or AI answers
Google’s performance recommendations continue to evolve, so it’s smart to monitor updates directly through web.dev and the broader Chrome DevTools guidance.
Frequently asked questions about Core Web Vitals
Are Core Web Vitals a direct Google ranking factor?
Yes, Core Web Vitals is part of Google’s page experience signals, which means it can play a role in rankings. But it is not a dominant factor on its own. Useful, relevant content still matters more. Think of Core Web Vitals as a supporting SEO advantage. If two pages are similarly relevant, the one with a better experience may have an edge.
What is a good Core Web Vitals score?
A good score means meeting Google’s recommended thresholds for all three metrics: LCP at 2.5 seconds or less, INP at 200 milliseconds or less, and CLS at 0.1 or less. These thresholds are designed around user experience, not just technical benchmarks. Passing all three consistently on mobile is the more meaningful goal.
How long does it take to see improvements after fixing issues?
Lab tools can show changes immediately after deployment, which is helpful for testing. Field data takes longer because it depends on real user activity being collected over time. In Google Search Console, updates often take several weeks to fully reflect, especially if traffic volume is lower or fixes affect multiple templates.
Can a WordPress site pass Core Web Vitals?
Yes, absolutely. Many WordPress sites pass Core Web Vitals when themes, plugins, images, hosting, caching, and scripts are managed carefully. The challenge is usually plugin bloat, oversized media, and too many third-party tools. A lightweight theme, disciplined plugin use, and image optimization can make a major difference.
Which matters more: mobile or desktop Core Web Vitals?
Mobile usually matters more because real users often experience slower conditions on phones, and Google’s broader search ecosystem prioritizes mobile usability. Desktop results are still useful for debugging, but a site that passes on desktop and fails on mobile still has a meaningful page experience problem that should be addressed first.
Do third-party scripts affect Core Web Vitals?
Yes, often quite a lot. Chat widgets, ad tags, tracking scripts, A/B testing tools, heatmaps, and social embeds can slow loading, block the main thread, and create layout shifts. Not every script is bad, but every script has a cost. The best practice is to audit them regularly and keep only the ones that clearly support business goals.
What is the easiest Core Web Vitals fix for marketers?
For many teams, the easiest win is image optimization. Large banners and blog visuals commonly slow LCP, especially on mobile. Resizing images before upload, compressing files, and avoiding unnecessary decorative media can help quickly. After that, reviewing popups, embedded tools, and excessive third-party tags usually produces the next set of gains.