Ever had a site go down and only learn about it from a customer message? That’s usually the moment developers start taking uptime monitoring seriously. A reliable server status checker doesn’t just tell you whether a server is online. It helps you spot slow responses, catch repeated errors, and understand when a service is degrading before it fully fails.
If you manage websites, APIs, staging environments, or internal tools, this matters more than ever in 2026. Users expect fast, stable experiences, and search engines reward reliable performance. In this guide, you’ll learn what a server status checker does, which metrics actually matter, how to use one properly, and where many teams make avoidable mistakes.
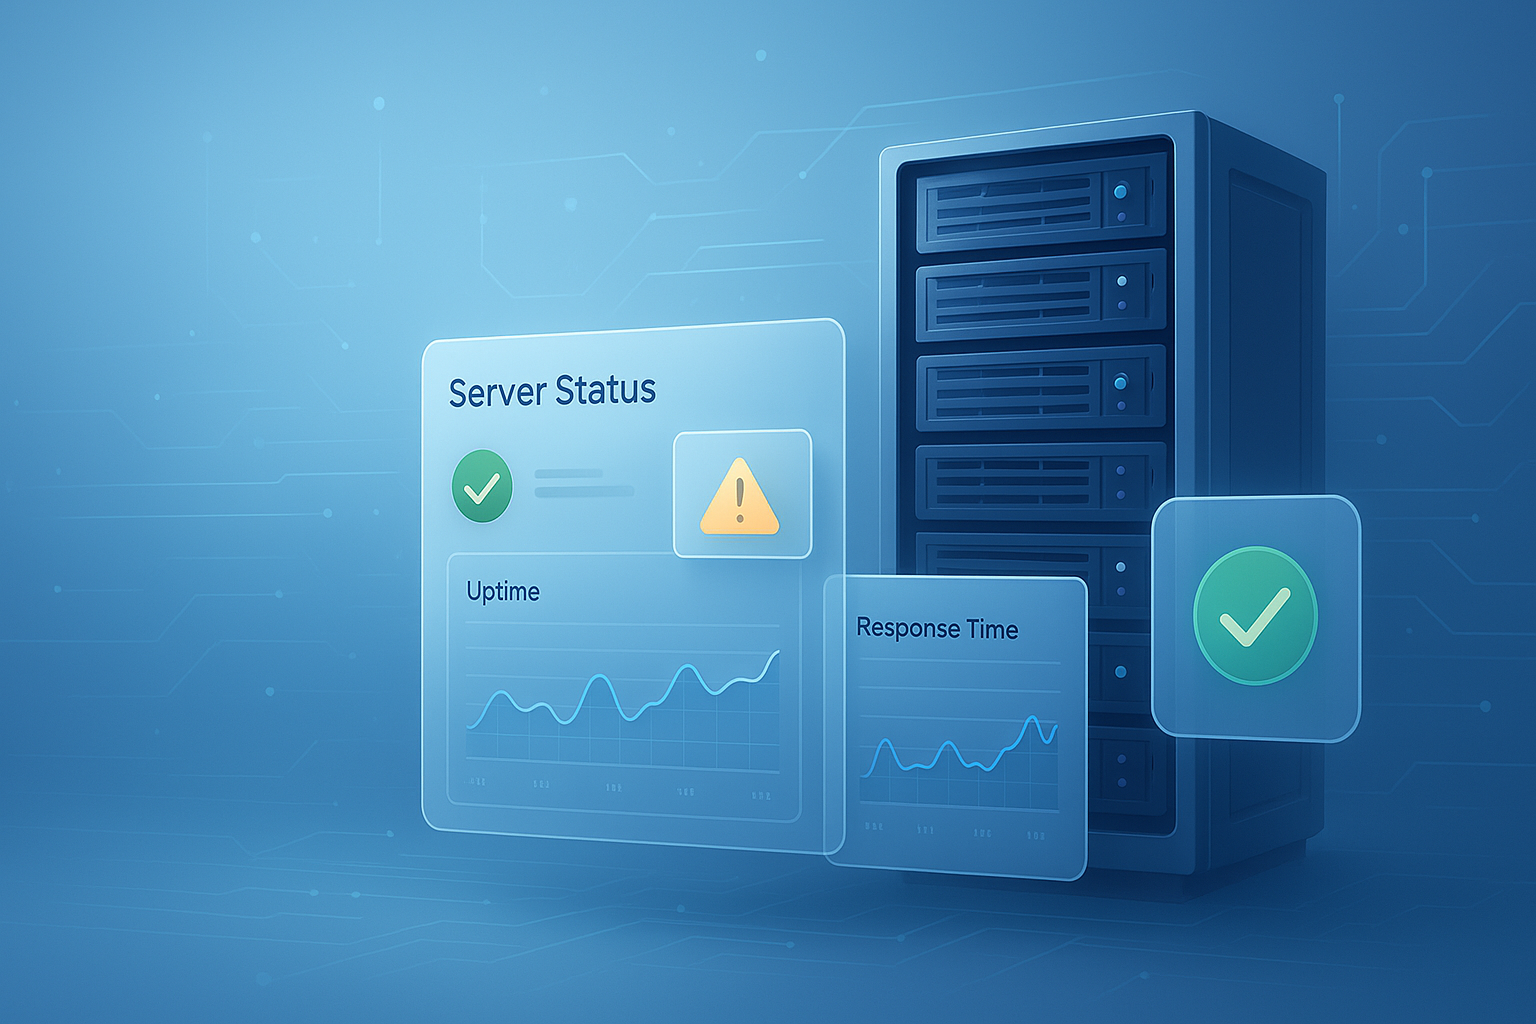
Suggested Image: Technology concept showing a dashboard with uptime, latency, and HTTP status indicators
What is a server status checker?
A server status checker is a tool that tests whether a server or website is reachable and measures how it responds. Most tools check availability, HTTP status codes, response time, and sometimes DNS, SSL, port access, and redirect behavior.
At a basic level, it answers questions like:
- Is the server online?
- How long does it take to respond?
- Is it returning the expected status code?
- Is the problem global or limited to one region or network?
- Are SSL or DNS issues preventing access?
This sounds simple, but the value comes from consistency. One manual check can tell you whether a site is up right now. Repeated checks reveal patterns. For example, a server may look fine during office hours but fail during traffic spikes, deployments, or database jobs.
If you’re also optimizing front-end delivery, tools like an Image Compressor can reduce page weight and improve perceived availability by making responses faster for real users.
Why developers use a server status checker
Developers use a server status checker to reduce guesswork. It gives quick visibility into uptime, errors, and performance so teams can troubleshoot faster and make better deployment decisions.
Here’s the problem. When an app feels “slow,” the cause isn’t always obvious. It could be the web server, application code, DNS, SSL expiration, a blocked port, overloaded resources, or even a third-party dependency. A good checker helps narrow the issue before you start digging into logs.
- Faster incident detection: Identify outages before users report them
- Improved debugging: Separate application errors from network or server issues
- Deployment validation: Confirm the server is healthy after changes
- Better uptime tracking: Understand reliability over time
- Performance monitoring: Track whether response times are creeping upward
For teams documenting APIs or technical troubleshooting steps, a clean format helps. If you’re sharing reports or exports, a tool like the PDF to Word Converter can make operational documents easier to edit and reuse.
What a server status checker should monitor
The best server checks go beyond a simple ping. They measure several layers of server health because a host can be reachable while the application itself is failing.
1. Uptime and availability
This is the simplest metric: can the service be reached? Availability checks often use HTTP, HTTPS, ICMP ping, or TCP connections. Uptime data is useful for trend reporting, vendor accountability, and SLA monitoring.
2. HTTP status codes
Status codes reveal what the server is actually returning. A live server returning a 500 error is available, but not healthy.
200 OK: Request succeeded301/302: Redirects in place403: Access denied404: Resource not found429: Too many requests500: Internal server error502/503/504: Upstream or availability issues
For exact HTTP behavior, MDN’s HTTP status code reference is one of the clearest authoritative resources available.
3. Response time
This metric shows how quickly the server returns a response. A functioning server that takes six seconds to answer is still a problem. Latency trends often reveal infrastructure strain before actual downtime appears.
If you need to communicate time-based metrics clearly across teams, a Time Duration Calculator can help convert incident windows or maintenance periods into easier-to-read summaries.
4. DNS resolution
If a domain fails to resolve, users may see the site as down even when the server is healthy. DNS issues are common after migrations, record changes, or misconfigured TTL settings.
For standards and fundamentals, the IANA DNS root documentation and official provider docs are more reliable than forum advice.
5. SSL certificate validity
An expired or mismatched certificate can break access, trigger browser warnings, or disrupt API integrations. Modern server checks should surface SSL expiration dates and validation errors.
Google’s broader guidance on secure connections and web quality can be explored through Google Search Central documentation.
6. Port connectivity
Web traffic may fail because the target port is closed, filtered, or blocked by a firewall. This matters for web servers, mail servers, SSH endpoints, and internal services.
7. Redirect chains and final destination
Sometimes the server is live, but users are routed through unnecessary redirects or sent to the wrong host. That affects speed, SEO, and reliability.
Server status checker vs ping test vs uptime monitor
These terms are often used interchangeably, but they aren’t the same. A server status checker usually gives more context than a basic ping test, while a full uptime monitor adds history, alerts, and reporting.
| Tool Type | What It Checks | Best Use Case |
|---|---|---|
| Ping test | Network reachability and latency | Quick connection diagnosis |
| Server status checker | Availability, HTTP status, response time, SSL, redirects | Manual verification and troubleshooting |
| Uptime monitor | Ongoing checks, alerting, logs, reports, SLA tracking | Production monitoring |
Now comes the important part. If you only run manual checks, you’ll miss intermittent issues. If you rely only on uptime percentages, you may miss slow failures that frustrate users long before the service goes fully offline.
How to use a server status checker effectively
A server status checker works best when you use it as part of a process, not just as a one-off utility. The goal is to confirm availability, detect anomalies, and gather useful information for the next troubleshooting step.
- Start with the public URL or IP address. Check whether the host responds at all.
- Review the HTTP status code. A 200 means something very different from a 503.
- Measure response time. Compare current performance with normal baselines.
- Confirm DNS resolution. Make sure the domain points where you expect.
- Inspect SSL details. Look for expiration, hostname mismatch, or trust issues.
- Test from multiple locations if possible. Some outages are regional.
- Cross-check logs and server metrics. The checker tells you what is happening; logs often tell you why.
If you’re presenting test results or incident notes to stakeholders, readability matters. A simple Word Counter can help tighten status updates and keep technical summaries clear.
Suggested Screenshot: Example server check dashboard showing URL, status code, and response time
What response times actually mean
Response time is one of the most useful metrics in a server status checker because it reveals performance degradation before outright failure. Still, it only makes sense when interpreted in context.
| Response Time | Typical Interpretation |
|---|---|
| Under 200 ms | Very fast for many web responses |
| 200 to 500 ms | Usually acceptable, depending on workload |
| 500 ms to 1 second | May indicate growing load or inefficient processing |
| Over 1 second | Often noticeable to users and worth investigating |
| Timeouts | Critical issue involving availability, networking, or application processing |
Here’s what experienced professionals do differently. They don’t judge latency from one isolated test. They compare:
- Peak traffic vs off-peak traffic
- Static pages vs dynamic endpoints
- Authenticated vs anonymous requests
- Regional differences
- Pre-deployment vs post-deployment behavior
For web performance concepts that connect server health to user experience, Google’s Core Web Vitals guidance on web.dev is worth reviewing.
Common causes of server errors a checker can reveal
A good checker won’t always tell you the root cause directly, but it often points you to the right category of problem. That saves time during incidents.
Application-level failures
- Unhandled exceptions
- Bad deployments
- Dependency failures
- Framework misconfiguration
Infrastructure issues
- Server overload
- CPU or memory exhaustion
- Disk space problems
- Load balancer misrouting
Network and access issues
- Firewall rules
- Closed ports
- DNS propagation delays
- CDN or proxy problems
Security and certificate problems
- Expired SSL certificates
- Invalid certificate chain
- TLS mismatch
- WAF blocks or rate limits
If you’re checking whether server-side changes have affected markup quality or crawlable content, an HTML to Markdown Converter can help inspect and simplify page output during debugging.
Best practices for monitoring uptime and server health
The best monitoring setups combine simple checks with smart thresholds. You want enough detail to catch problems early, but not so much noise that alerts become background clutter.
- Monitor more than the homepage. Include API endpoints, login routes, and critical user paths.
- Set realistic intervals. Production services may need checks every 1 to 5 minutes.
- Use alert confirmation. Avoid waking people up for one failed probe.
- Track historical trends. Slow degradation matters as much as outages.
- Test from multiple regions. Localized failures are easy to miss.
- Validate after deployments. A fresh release is a common failure point.
- Document expected behavior. Know which status codes and redirects are normal.
This is where many people struggle. They monitor only basic uptime and assume that means users are fine. In reality, a 200 response from a broken page template, empty API payload, or stalled app shell can still leave users stuck.
If you maintain developer documentation or monitoring notes, improving structure with an online Case Converter can help standardize endpoint names, incident labels, and report headings.
Server status checker metrics that matter most for developers
If you need to prioritize, focus on the metrics that help you diagnose fast. Not every signal deserves equal attention.
| Metric | Why It Matters | Developer Action |
|---|---|---|
| HTTP status code | Shows whether requests succeed or fail | Trace application, routing, or access issues |
| Response time | Reveals performance degradation | Check load, queries, caching, and external calls |
| Availability rate | Tracks reliability over time | Review incidents and improve resilience |
| SSL validity | Prevents browser and client trust failures | Renew or reconfigure certificates |
| DNS result | Affects reachability before HTTP begins | Verify records, propagation, and host mapping |
For deeper operational guidance across Microsoft-hosted environments, Microsoft Learn is a strong reference point, especially for Azure networking, monitoring, and diagnostics.
Common mistakes when checking server status
Most false conclusions come from incomplete checks. A server may appear down when the issue is local, or appear healthy when only a non-critical endpoint was tested.
- Testing a cached page only: The backend may still be failing
- Ignoring redirects: The final destination may return an error
- Checking from one location: Regional routing issues can be missed
- Trusting one successful response: Intermittent failures need repeated checks
- Confusing ping success with application health: Network reachability is not app readiness
- Overlooking SSL warnings: Users and clients may reject the connection
- Failing to verify expected content: A 200 code doesn’t guarantee a usable page
If you’re comparing raw responses during troubleshooting, tools that simplify transformations can help. For example, an JSON Formatter makes API error payloads easier to inspect when status checks reveal failing endpoints.
How server status affects SEO and user experience
Server reliability is not just an ops concern. It affects crawlability, indexing stability, user trust, and conversion rates. Slow or unstable servers can reduce the quality of both human and search engine access.
Search engines need consistent access to page resources. Long outages, frequent 5xx responses, or very slow responses can limit crawling efficiency. Google’s official recommendations on this topic are best understood through Google’s documentation on HTTP and network errors.
From the UX side, users often interpret delay as unreliability. Even when pages eventually load, repeated slowness damages confidence. This small detail changes everything: uptime percentages alone do not describe actual user experience. A site can be “up” while still failing the people using it.
Practical server status checking workflow for small teams
If you don’t have a large DevOps setup, keep the workflow simple. The goal is fast visibility, clear escalation, and basic trend tracking.
- Define critical endpoints. Homepage, login, API health route, checkout, webhook receiver.
- Set baseline expectations. Expected status codes, average response times, SSL expiry window.
- Run scheduled checks. Use short intervals for critical services.
- Create alert tiers. Warning for latency spikes, critical for confirmed downtime.
- Log incidents consistently. Note timestamps, regions, symptoms, and fix applied.
- Review after each outage. Look for patterns, not just one-off explanations.
Suggested Infographic: Small-team monitoring workflow from check to alert to root-cause review
Frequently asked questions
Is a server status checker the same as website monitoring?
Not exactly. A server status checker is often used for direct checks of availability, response codes, latency, SSL, and related technical signals. Website monitoring usually includes ongoing automated checks, notifications, and historical reporting. In practice, a status checker is great for validation and troubleshooting, while a monitoring platform is better for continuous production oversight.
Can a server status checker detect application bugs?
It can reveal symptoms, but not always the exact bug. For example, repeated 500 errors, long response times, or failed API calls may indicate application problems. However, you’ll still need logs, traces, and debugging tools to identify the root cause. Think of the checker as the early warning system, not the complete diagnosis.
What is a good uptime target for most websites?
Many teams aim for 99.9% availability or better, but the right target depends on the business impact of downtime. A brochure site and a payment API do not have the same tolerance for outages. More important than chasing a number is understanding what your percentage means in real minutes of downtime and whether users experience slow failures that uptime alone doesn’t capture.
Why does my server pass a ping test but the website still fails?
Because ping only checks basic network reachability. It doesn’t confirm that your web server, application, database connection, SSL setup, redirects, or page rendering are working correctly. A host can respond to ICMP while still returning 500 errors or timing out on HTTP requests. That’s why developers use a server status checker instead of relying on ping alone.
How often should I check server status?
For production systems, checks every 1 to 5 minutes are common for critical services. Less critical sites may use longer intervals. The right frequency depends on how quickly you need to detect issues and how much alert noise your team can handle. If checks are too infrequent, outages can go unnoticed. If they’re too aggressive, you may generate unnecessary noise or load.
Are free server status checker tools enough?
For manual checks and basic troubleshooting, yes, free tools are often enough. They’re useful for confirming whether a server is online, measuring response time, and spotting obvious errors. If you need alerting, history, regional monitoring, SLA reports, or integrated incident workflows, you’ll likely outgrow simple free tools and move toward a full monitoring setup.
Can server issues hurt search rankings?
Yes, serious or repeated server issues can affect crawling and indexing. If search engines frequently encounter 5xx errors, timeouts, or inaccessible resources, they may reduce crawl efficiency and have trouble refreshing content. One brief outage is not usually catastrophic, but ongoing server instability makes it harder for search systems to trust access to your pages.
What should I check first when a site seems down?
Start with the URL response, HTTP status code, and response time. Then verify DNS resolution, SSL validity, and whether the issue appears from more than one network or location. After that, review recent deployments, logs, infrastructure metrics, and third-party dependencies. This order helps you rule out broad access issues before jumping into application internals.
Conclusion
A server status checker is one of the simplest tools developers can use to improve reliability. It helps confirm uptime, detect errors, and measure response times, but its real value comes from using it consistently and interpreting the results in context. Availability, latency, DNS, SSL, and status codes together give you a far clearer picture than any single metric alone.
If you want a practical next step, identify your most important endpoints and start checking them on a schedule. Then document what “healthy” looks like for each one. As you refine your workflow, related FreeToolr utilities like the URL Encoder Decoder, Image Compressor, JSON Formatter, and Word Counter can help with testing, payload inspection, optimization, and cleaner incident communication.