Need to get source code of webpage content quickly? You’re not alone. Developers do this all the time to inspect markup, debug layouts, study site structure, verify meta tags, or learn how a page is built.
The catch is that many people mix up page source, live DOM, and backend code. They are not the same thing. If you know which one you need, the process becomes much easier.
This guide shows how to get source code of webpage pages using browser tools, keyboard shortcuts, the view-source: command, mobile workarounds, and online methods. You’ll also learn what you can and cannot access, where beginners get stuck, and how to inspect code safely in 2025.
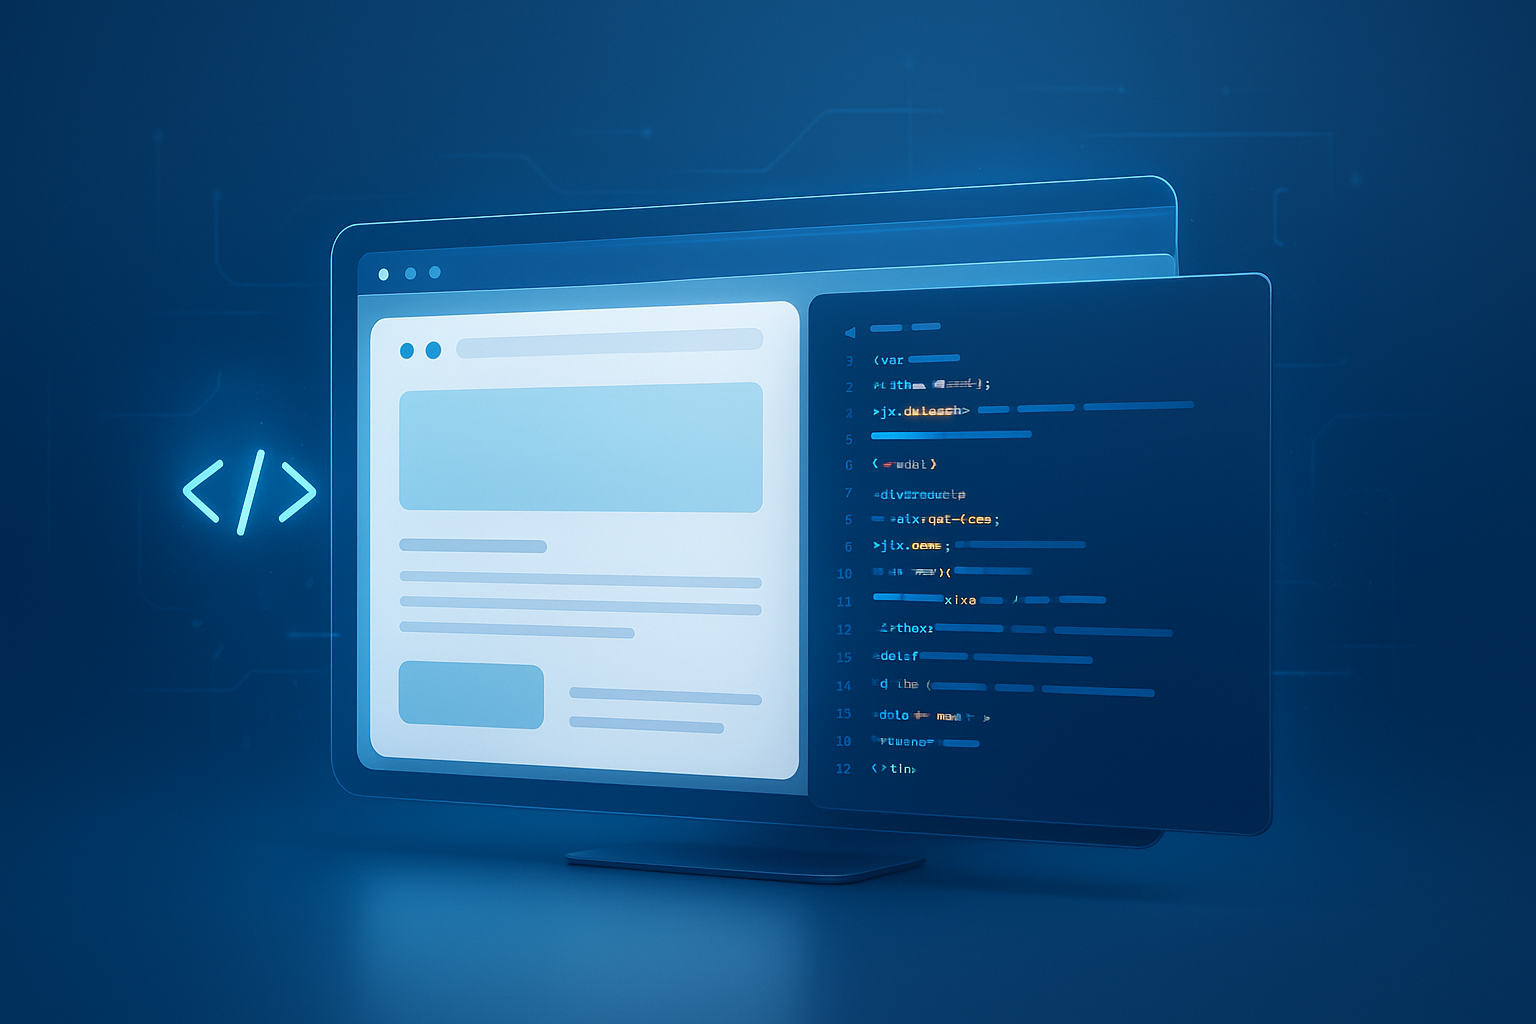
Suggested Image: Technology concept showing a browser window, HTML tags, and developer tools panel
What does “get source code of webpage” actually mean?
In most cases, getting the source code of a webpage means viewing the HTML that the browser received when the page loaded. Sometimes it also includes CSS, JavaScript, images, and network files. It does not usually mean downloading the site’s server-side code such as PHP, Python, Node.js, or database logic.
- Page source: The original HTML document delivered to the browser
- Rendered DOM: The live version of the page after JavaScript changes it
- Assets: CSS, JavaScript files, fonts, images, and API requests
- Backend code: Server-side files you generally cannot access from a browser
This distinction matters. If you open page source and don’t see the content you expected, JavaScript may be injecting it later. In that case, browser inspection tools are the better option. If you also need to clean up snippets you collect from a page, a simple text case converter tool can help normalize headings, labels, or copied strings during documentation.
Fastest ways to get source code from any webpage
If you want the shortest answer, use your browser’s built-in tools. The exact method depends on whether you need the raw HTML source, the rendered elements, or linked resources.
- Right-click the page and choose View Page Source to see raw HTML
- Right-click and choose Inspect to open live developer tools
- Type
view-source:https://example.comin the address bar - Use keyboard shortcuts for speed
- Save the page locally if you need an offline copy of the visible output
| Method | Best For | What You See |
|---|---|---|
| View Page Source | Original HTML | Server-delivered page source |
| Inspect / DevTools | Live structure and debugging | Rendered DOM, CSS, JS, requests |
view-source: URL |
Quick direct access | Raw page source in browser |
| Save Page As | Offline review | HTML file plus downloaded assets |
How to view page source in Chrome, Edge, Firefox, and Safari
The easiest way to get source code of webpage content is to use the browser menu or shortcut. This shows the raw HTML response, which is useful for checking metadata, schema, canonical tags, and basic markup structure.
Chrome
- Open the webpage
- Right-click anywhere on the page
- Select View Page Source
- A new tab opens with the HTML source
Shortcut: Ctrl + U on Windows or Cmd + Option + U on Mac.
Microsoft Edge
- Open the webpage
- Right-click the page
- Choose View Page Source
Shortcut: Ctrl + U.
Firefox
- Visit the webpage
- Right-click
- Choose View Page Source
Shortcut: Ctrl + U on Windows or Cmd + U on Mac.
Safari
- Enable the Develop menu in Safari settings if it isn’t visible
- Open the page
- Use the Develop menu to inspect elements or view source-related tools
Safari workflows can differ slightly from Chromium browsers, so Apple’s developer documentation is the most reliable reference when menu names change by version.
For browser-specific inspection behavior, the Mozilla Developer Network and Safari Web Inspector documentation are both solid references. If you’re reviewing page color styles at the same time, a quick color picker tool can help capture exact hex values from a design audit.
How to inspect the live DOM instead of the raw source
This is where many people struggle. The source code you see with “View Page Source” may not match what appears on screen. Modern sites often modify content after load using JavaScript. To see the actual live structure, use Inspect.
- Right-click the element you care about
- Choose Inspect
- The developer tools panel opens and highlights that element
- Expand parent and child nodes to study the full structure
- Review computed styles, event listeners, layout, and accessibility details
In Chromium-based browsers, you can also open DevTools with F12 or Ctrl + Shift + I. Firefox offers a similar inspector.
Use Inspect when you need to:
- Find dynamically loaded text
- Debug broken HTML or CSS
- Copy a specific element
- Extract a button, section, table, or form markup
- Check whether scripts changed the page after load
If you’re working with copied snippets and need to remove extra spacing before pasting into an editor, a remove line breaks tool can save time during cleanup.
Using the view-source URL command
The view-source: command is one of the fastest ways to open page source directly. You simply place it before a full webpage URL in the browser address bar.
Example:
view-source:https://example.com
This method is useful when:
- You want to skip right-click menus
- You’re documenting URLs in a workflow
- You need to open source for several pages in sequence
- You’re helping non-technical teammates follow a repeatable process
It’s simple, but remember that it still shows the raw source, not the final rendered DOM. If your page relies heavily on client-side rendering, this method can appear incomplete.
How to download or save a webpage’s source code
If you need a local copy, saving the page is often better than copying from the browser window. This gives you an HTML file and sometimes a folder of supporting assets, depending on the save option you choose.
- Open the webpage
- Use Save Page As
- Select Webpage, HTML only or Webpage, Complete
- Save the file to your computer
Webpage, HTML only usually saves just the markup file. Webpage, Complete typically downloads linked assets such as images and stylesheets too.
This is useful for:
- Offline analysis
- Archiving visible page output
- Studying file organization
- Testing how a page behaves locally
For saved code or notes you want to keep shareable, converting your findings into a portable format with a JPG to PDF tool can be helpful if you’re documenting screenshots for a team handoff.
Can you get CSS and JavaScript files too?
Yes, but usually not from one screen alone. The raw page source often contains links to external stylesheets and scripts rather than the full contents of those files. To inspect them, open the linked file URLs or use the Sources and Network panels in DevTools.
- CSS: Look for
<link rel="stylesheet">tags or inspect styles in DevTools - JavaScript: Look for
<script>tags, linked bundles, or API activity in Network - Images and fonts: Review asset URLs in source or loaded files in Network
For technical references on how HTML documents link to resources, the HTML Standard and Chrome DevTools documentation are excellent sources.
If you’re also testing page performance assets, optimized visuals matter. After reviewing image-heavy pages, many developers use an Image Compressor to reduce file sizes before deployment.
What you cannot get from a webpage
Now comes the important part. Viewing a webpage does not give you access to everything behind it. Browsers only receive what the server chooses to send to users.
- You can access delivered HTML, CSS, JavaScript, images, and visible API responses
- You cannot normally access server-side source code such as PHP, ASP.NET, Python, Ruby, Java backends, or database queries
- You cannot legally bypass authentication, encryption, or access controls
This is why “get source code of webpage” can be misleading. You’re getting the client-facing code, not the application internals. For standards-based guidance on responsible web use and platform behavior, the W3C is a trustworthy reference point.
How to view source code on mobile devices
Mobile browsers are less convenient for source inspection. Some support limited developer workflows, but most users need a workaround. The most practical method is usually switching to a desktop browser.
You can try these options:
- Use the
view-source:prefix in some mobile browsers if supported - Request the desktop site, then inspect available options
- Use remote debugging from a desktop machine for Android devices
- Use Safari Web Inspector with a Mac for iPhone debugging
For deeper mobile debugging, Android developer options documentation and Apple’s Safari tooling docs are more reliable than random forum advice.
If you need to quickly capture a mobile page as a shareable visual record, a WebP to PNG converter can help when the source site uses image formats that are inconvenient for reports or presentations.
How developers use webpage source code in real work
Looking at source code isn’t just for curiosity. It solves real development and SEO problems. Once you know what to inspect, you can diagnose issues much faster.
- Verify title tags, meta descriptions, canonicals, and robots directives
- Check schema markup and structured data presence
- See whether content is present in source or injected later
- Inspect classes, IDs, and component structure for UI debugging
- Review linked scripts, preload tags, and stylesheet loading
- Analyze forms, buttons, and semantic HTML choices
For SEO-specific checks, Google’s official Google Search documentation is more useful than guesswork. When measuring the length of metadata you pull from source, a character counter tool is practical for title tags and meta descriptions.
Suggested Screenshot: Browser DevTools highlighting an HTML element and its CSS rules
Common mistakes when trying to get source code of webpage pages
Most problems come from expecting the wrong type of code. Here’s what experienced professionals do differently: they first decide whether they need original source, rendered HTML, resource files, or screenshots.
- Mistake 1: Assuming page source equals what you see on screen
- Mistake 2: Thinking backend code is publicly visible
- Mistake 3: Copying DevTools output without checking nested elements
- Mistake 4: Ignoring JavaScript-rendered content
- Mistake 5: Saving the page locally and expecting it to behave exactly like the live site
- Mistake 6: Forgetting that minified code may be hard to read without formatting
When code is compressed into long unreadable lines, formatting or line cleanup tools can help. If the page includes encoded URLs or strings, a URL encoder and decoder can make copied values easier to inspect.
Best practices for inspecting source code safely and efficiently
Viewing source is generally safe, but your workflow should still be careful. You’re often handling third-party code, scripts, links, and downloaded files. Basic caution goes a long way.
- Use browser tools first before installing extensions
- Prefer official documentation over forum shortcuts
- Don’t run copied scripts unless you fully understand them
- Use a separate test environment for experiments
- Respect site terms, authentication, and licensing
- Document what you found so teammates can reproduce it
If you’re saving notes from multiple inspections, keeping them structured matters. Many teams pair source review with screenshots, short annotations, and file naming conventions so findings are easy to revisit later.
View source vs inspect element vs save page
The answer depends on one thing: what you actually need. If you choose the wrong method, you may think content is missing when it’s simply being shown in a different way.
| Option | Use It When | Limitation |
|---|---|---|
| View Source | You need original HTML and metadata | May not show JS-rendered content |
| Inspect Element | You need the live DOM, CSS, layout, or events | Can feel overwhelming for beginners |
| Save Page | You need an offline snapshot | Local copy may not fully recreate the live experience |
Frequently asked questions
Is viewing a webpage’s source code legal?
Viewing source code that a website sends to your browser is generally normal browser behavior. That said, legal use depends on what you do next. Reading public HTML is not the same as copying proprietary work, bypassing restrictions, scraping protected data, or reusing code in violation of copyright or terms of service. If you’re working commercially, check the site’s policies and your local legal framework.
Why does page source look different from the page I see?
Many websites build part of the page after it loads. JavaScript can add text, move elements, inject templates, or request data from APIs. “View Page Source” shows the original document response, while “Inspect” shows the live DOM after those changes happen. If visible content is missing from source, open DevTools and inspect the rendered page instead.
Can I get the backend code of a website from the browser?
No, not under normal circumstances. Browsers receive frontend output, not the application’s private backend files. You can usually view HTML, CSS, JavaScript, media files, and some API responses, but not server-side logic such as PHP, Python, Node.js handlers, or database queries. If a site exposes that by mistake, it’s a security issue, not expected behavior.
What’s the easiest way to copy a specific section’s HTML?
Use Inspect rather than View Source. Right-click the exact element, choose Inspect, then copy the highlighted node or outer HTML from DevTools. This is more precise because it targets the section you care about instead of making you search through the full document. It also works better for components that were added dynamically after the page loaded.
Do I need any special software to get source code of webpage pages?
No. Every major desktop browser already includes what you need. Chrome, Edge, Firefox, and Safari all support source viewing and developer inspection tools. Online viewers and browser extensions exist, but they’re usually unnecessary for basic tasks. Start with built-in tools first. They’re faster, safer, and more reliable than third-party utilities for most development work.
Can I view source code on my phone?
Sometimes, but the experience is limited. A few mobile browsers support direct source viewing or partial debugging tricks, and remote debugging is possible for developers. Still, it’s usually easier to use a desktop browser when you need serious inspection. If you only need quick verification, try the view-source: prefix or request the desktop version of the site.
Why is the code all on one line and hard to read?
That usually means the file is minified. Websites compress HTML, CSS, and JavaScript to improve performance by removing spaces, line breaks, and comments. The code still works, but it’s harder for humans to read. In DevTools, some files can be prettified. You can also paste snippets into formatting tools or editors that support automatic indentation.
What should I check first when auditing a webpage’s source?
Start with the basics: title tag, meta description, canonical tag, robots directives, heading structure, schema markup, stylesheet links, and script loading. Then compare source output with the rendered DOM to see whether important content is server-rendered or injected later. That quick sequence gives developers and SEOs a strong first diagnostic pass without wasting time on lower-priority details.
Final takeaway
If you need to get source code of webpage pages, the best method depends on your goal. Use View Page Source for raw HTML, Inspect for the live DOM, and Save Page As for offline review. Remember that frontend code is visible, but backend code usually is not.
A practical next step is to open one page in your browser and compare all three methods side by side. That single exercise makes the difference between source, rendered output, and saved files very clear.
As you continue your workflow, related tools can help: an HTML to Markdown converter for documentation, an Image Compressor for web asset cleanup, a character counter tool for metadata checks, and a URL encoder and decoder for inspecting copied links and parameters.